

Product & Deployment
StreamGroomer management
Smart Service Tree
Solution Module
Safety Management
Performance monitoring / Reporting / Proactivity
Smart Netflow Export
Customized web portals
Automated PDF reports
Statistics collection and storage
Scorecard
Dynamic performance mapping
Alarms
Real-time monitoring
Monitoring
Troubleshooting tools
Monitoring VoIP and Video applications
Network Monitoring
Action & Optimization
QoS
SDWAN
NDR AI
Load balancing / Hybrid network / SDWAN
Collecting and storing statistics
MMS automatically collects the data every 10 minutes, and saves the statistics in a database.
The storage time for statistical data by granularity can be configured as required. The default storage time is as follows:
- For 5 days at 10-minute intervals
- For 15 days at 30-minute intervals
- For 60 days at 2-hour intervals
- For 2 years on a 1-day granularity
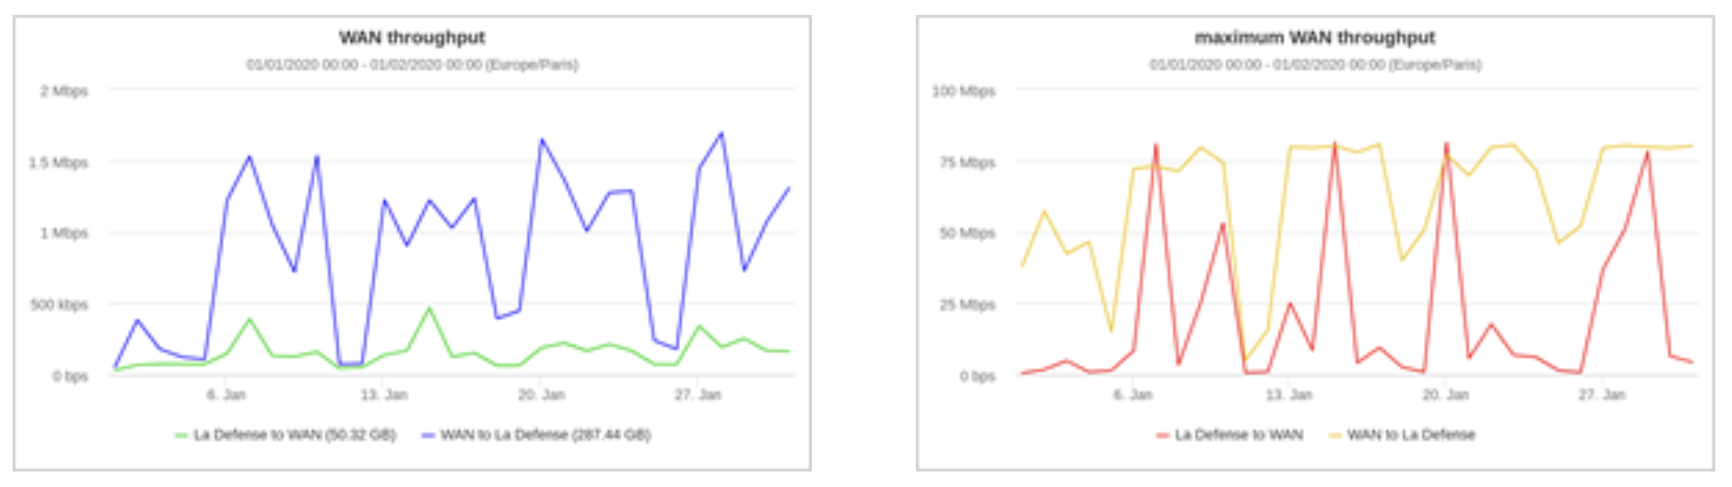
Des mesures moyennes sur de longues périodes ne reflètent pas l’expérience utilisateur, par conséquent, des informations associées aux pics de trafic sont également stockées.
Ainsi, les responsables du SI peuvent superviser les changements sporadiques mais aussi les tendances fortes, ce qui leur permet de comprendre les variations d’ensemble dans l’utilisation des ressources.
Aggregate site statistics
Pour tous les sites gérés par la solution, le SGM agrège automatiquement toutes les statistiques associées à chaque site.
En effet, ces données sont mesurées notamment par des StreamGroomers déployés sur un ou plusieurs Datacenters lorsque le site n’est pas équipé de StreamGroomer.
Par exemple, les graphes liés aux indicateurs suivants sont disponibles, que l’agence soit équipée ou non :
- Total volume or flow
- Breakdown of throughput between applications
For a datacenter, advanced aggregation functions can be used to present, for example :
- Breakdown of throughput by category, remote site or application
- For each application, consolidated indicators as well as top remote sites for the following measurements: volume, number of users, response time, etc.
Aggregate category statistics
Des fonctions puissantes et flexibles d’agrégation de statistiques permettent ainsi de fournir des informations de haut niveau sur les différentes catégories, telles que les Business Unit ou les entités géographiques.
De plus, nous consolidons le volume de trafic et les mesures applicatives ou VoIP sur n’importe quelle catégorie. Par ailleurs, nous affichons le Top 10 sites au sein de la catégorie pour chaque indicateur applicatif (volume, nombre d’utilisateurs, temps de réponse) ou VoIP (volume, nombre de communications, MOS).